Tracker system monitoring
To monitor the tracker itself, go to the Monitor tab in the topmost menu of the tracker (black bar):

You will see information about your current user and its local data:

Here you will also find links to check for updates, the status of the license and the changelog.
Detailed information about your server is displayed below, it refreshes using a separate script every hour:

Here you can find the amount of total and free space on your server, RAM, the number of cores/threads, uptime, software installed, etc.
If you do not have this information - most likely you do not have our script installed. Please check our FAQ in order to install one.
An important part of the Monitor is the tracker load bar:

It shows how much load your tracker is currently experiencing.
Loads above 80% indicate that you need to upgrade to a more powerful server.
Be careful - when are updating costs - the load of the tracker can reach 100%. However, this is not critical. While updating you will see a notification to the right of the main information.
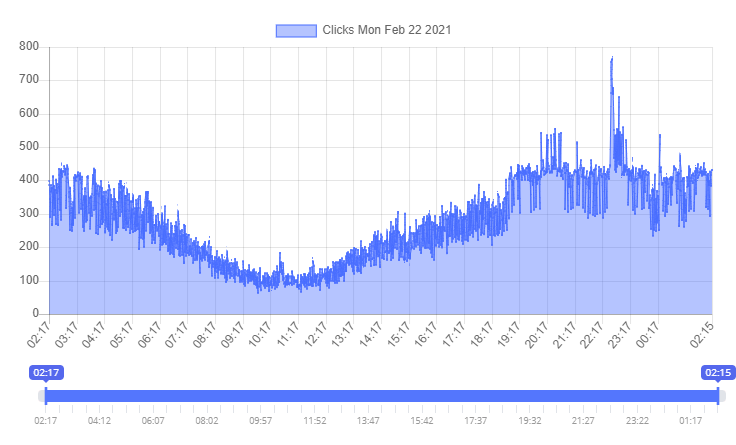
The volume of traffic you can check is displayed on graph below:

The tracker only stores data from the last 24 hours and by using the slider below you can study any interval in more detail.
